Social Network Analysis: Julie, Matt, and Charles
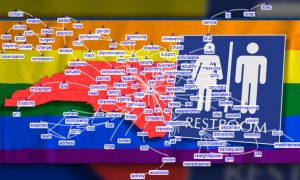
As tension over the recently passed North Carolina House Bill 2 comes to a boil, our group thought it relevant to delve into and further explore the legislation and its implications from a social media standpoint. Our search term, then, was #hb2, and the resulting Social Network Analysis shows the interconnected web of the sociopolitical issue through major figures involved, media platforms, organizations, categorizations, declamatory statements, and calls to action accordingly. Superimposed over a background image that represents what is colloquially being known as “the bathroom bill”, the vertices–and the edges that intertwine them–bridge the gaps in the information, while providing valuable insight into accessibility and dissemination.
To research this, we downloaded 12,000 tweets from Twitter that mention HB2. From there, we altered the graph metrics and selected the option to view “words and word pairs” and calculated those metrics. In doing this, NodeXL Pro leaves out all words that are only mentioned once, meaning we received a list of words that were mentioned in at least two tweets; this lead to a fairly long list. Obviously, the most mentioned term was HB2, followed by RT, leading us to believe that many people were utilizing Twitter to spread information more than supply opinions. At the bottom tab, we then switched from “Words” to “Word Pairs,” allowing us to see a ranking of two words that were commonly used at the same time. Because this list, too, was very long, we decided to only use words that were paired together at least 12 times as to make sure we were only using common data and not including outliers. We copied this list and moved it over to a new NodeXL spreadsheet. To further clean up the results a bit, we got rid of words like “a,” “the,” or some minor adjectives like “damn.” The graph is originally like a spiderweb of dots and upon hovering over them, the words are shown. To make graph comprehension simpler, we added labels so each word is directly on the graph.
Upon review of the visualization, ultimately two “major players” in terms of persona are identified: Pat McCrory and Dominick Evans. McCrory, who signed the bill into law last month, has faced a torrent of backlash from many equal rights groups and activists–among them–Dominick Evans. The role of these two figures is clearly defined, as one has essentially made history by passing this bill, and the other is adamantly attempting to reverse history by getting it repealed. Multiple media platforms are involved, both old and new. NBC, The News & Observer, The Raleigh Reporter, and Twitter each make an appearance. Through these outlets, information about the bill itself has been distributed to the masses. Perhaps the most integral components of the visualization are the groups associated with it. The LGBTQ community, which stands for lesiban, bisexual, transgender, and queer, is represented through a number of different organizations. The Task Force, which is the National LGBTQ task force, the TransDVP (Or Trans Disability Visibility Project), which is an effort to raise awareness toward the plight of those with trans and disability stigma, and DisVisibility which is described on Twitter as: An online community dedicated to recording, amplifying, and sharing disability stories and culture, are all accounted for. These organizations, and their declamatory accusations and categorizations of bigotry, discrimination, and tokenization, are echoed by their supporters through mentions and retweets. From this point, calls to action stem, such as the popular #repealhb2.
The top influencers within our analysis model can be derived from the top word pairings. For the sake of space, the top five word pairings are between: @TheTaskForce and RT with 116; @DisVisibility and RT with 76; Transdvp and hb2 with 72; North and Carolina with 72; and star and game with 71. RT, which is the universal abbreviation for retweet, is paired with the twitter of both The Task Force and Alice Wong of Disvisibility, signaling an echo of sentiments among activists and supporters. #Hb2, which all roads lead to in the visualization itself, is connected with–among many other terms–#Transdvp, a movement trying to fight it. North and Carolina are obviously relevant in that they combine to compose the name of the very state where the controversial law has been adopted. Finally, star and game come together amid speculation and demands that NBA Commissioner Adam Silver remove next year’s All-Star Game from Charlotte in protest of the legislation. Between the lines of the analysis, one could learn about the opposers of hb2, what they’re saying, who they’re getting their information from, who they’re making connections and forming support systems with, and how the topic may shape our society moving forward.
While our sentiment analysis accounts for those who feel negatively about or oppose House Bill 2, it would be interesting to conduct an analysis on those who support it. Oddly enough, our analysis is limited in terms of the supporting perspective. Items such as “a9” or “a11” should be more thoroughly examined, as they may correspond to specific and relevant articles of the framework itself. Furthermore, questions are raised as to how these different entities will influence this legislation, as well as similar ones as they pop up around the country, moving forward. Ultimately, only time will truly tell the story of this watershed moment in our history, but our Social Network Analysis highlights a significant turning point in our discourse of human rights.
Time Range: Thursday, April 14, 3:00 p.m. – 7:00 p.m.
Metrics:
Graph Type: Undirected
Vertices: 125
Unique Edges: 138
Edges With Duplicates: 10
Total Edges: 148
Self-Loops: 0
Connected Components: 7
Single-vertex connected components: 0
Maximum vertices in a connected component: 111
Maximum edges in a connected component: 140
Diameter: 14
Avg. Geodesic Distance: 5.18
Graph Density: .0185

 Previous Post
 Next Post